CHARGED TRACKS ANALYSIS
See CDF-notes
5288 (physics analisys) and
5575 (complementary studies and efficiency corrections).
In this study we try to characterize soft interactions (whatever they are)
and to find any peculiar behavior which
exhibit specific properties that may help us to understand them.
We start working with a sample of events which are collected without requiring
any particular "a priori" condition
("minimum bias" events). Out of minimum-bias events we select the "soft"
ones by applying the only selection
criterium that we know to be valid for them: we require that they do not
show up as jets (jets are spreads of collimated
fast particles that are typical of head-on parton collisions). In our particular
definition of "soft" events we include all
events with no jets of energy greater than 1.1 GeV. This number is suggested
by the detector ability to measure a jet
energy, but we show that the results do not critically depend on this particular
value.
Finally we study the properties of selected soft events as compared to all the others. In particular we analyze:
This is an unexpected and new result, and the analysis is the first one
of this kind ever published.
Part of the plots blessed for this analisys:
1. primary charged particles multiplicity
distributions, in KNO form (MB)
2. primary charged particles multiplicity distributions,
in KNO form (soft)
3. primary charged particles multiplcity distributions,
in KNO form (hard)
4. average charged particles pT vs multiplcity
(MB)
5. average charged particles pT vs multplicity
(soft)
6. average charged particles pT vs multiplcity
(hard)
ANALYSIS OF K 0s AND Lambda 0
See CDF-notes
6075 and
6043 (pick latest versions).
Besides the lighter quarks u and d , strangeness
production is the only component of low-pT
multiparticle interactions to be statistically significant and experimentally
accessible with a
Minimum-Bias trigger. It is also a valid probe to investigate the transition
of soft hadron
interactions to the high-pT QCD perturbative region.
This paper describes an analysis of k and Lambda (V0) production in pp
interactions. It is part of
a low-pT multiparticle production systematic study structured in comparative
analyses of
statistical distributions and particle correlations at different c.m.s. energies.
Specific emphasis is given to the dependence of the particle correlations
on charged multiplicity
and to the ``hardness'' of the interaction.
In analogy with the paper described above the whole analysis was repeated
on two different types
of events that have been selected by dividing MB data into soft and hard
sub-samples.
Inclusive distributions of multiplicity and transverse momentum of K and
Lambda are presented
first. The high statistics of the data sample collected at sqrt(s)=1800 and
630 GeV and accurate
efficiency corrections, allow to extend the range of these measurements and
their precision with
respect to previous ones.
Studies of the dependence of the average pT of V0 and of their mean number
on the event charged
multiplicity are also presented. It is not possible to enphasize any difference
of the <pT> dependence
with multiplicity at the two energies, even in the full MB sample. This is
even more so for the soft
and hard sub-samples. Nevertheless the behavior of the three sub-samples is
clearly different.
The kinematic selection of K and Lambdas (described in note 6075)
Includes efficiency + "fakes" + acceptance + contamination.
Efficiency: is computed in two ways: with full MC generation/simulation/reconstruction
and
by embedding fake k/L0 into real min-bias events;
Fakes: we mean by this fake associations of secondary tracks, but also V0
which are
reconstructed
outside of our defined limits for the efficiency and also the
contamination
of K in the L0 sample and viceversa;
Acceptance: originated by our fiducial cuts in Lxy and pT of the V0
decay products
Overall correction is computed as C = (1 - Fakes)/(Efficiency x Acceptance)
Blessed plots:
1. invariant mass distributions of pi-pi and p-pi
pairs (MB, 1800 GeV)
Invariant mass distribution of the decay products of k and Lambdas
after kinematical selection.
No correction is applied.
2. lifetime distribution of k, raw and corrected
(MB, 1800 GeV)
The lifetime distribution of k is shown before and after effciency
correction.
The mean value is (0.881+-0.006)E-10 s
3. lifetime distribution for Lambda, raw and corrected
(MB, 1800 GeV)
The lifetime distribution of k is shown before and after effciency
correction.
Te mean value is (2.62+-0.08)E-10 s
4. distribution of multiplicity of k for the MB,
soft and hard data samples (630 and 1800 GeV)
Probability for finding 1,2,3,4 k in a event. MB, soft and hard data
samples are shown.
5. distribution of multiplicity of Lambda for the
MB, soft and hard data samples (630 and 1800 GeV)
Probability for finding 1,2,3 Lambda in a event. MB, soft and hard
data samples are shown.
6. invariant pT distribution of k for the MB, soft
and hard samples (1800 GeV)
The inclusive invariant pT dustributions of k (MB, soft and hard)
at 1800 GeV.
We use the form: A( p0 / (pT+p0))exp(n) to fit MB distribution and
obtain that
<pT>=0.74+-0.07 GeV/c
7. invariant pT distribution of k for the MB, soft
and hard samples (630 GeV)
The inclusive invariant pT distributions of k (MB, soft and hard)
at 630 GeV.
With the same form <pT>=0.70+-0.08 GeV/c
8. invariant pT distribution of Lambda for the MB,
soft and hard samples (1800 GeV)
The inclusive invariant pT distributions of Lambda (MB, soft and hard)
at 1800 GeV.
The above form gives <pT>=0.95+-0.09 GeV/c. An exponential function
fits the
data equally well and gives <pT>=1.03+-0.01 GeV/c
9. invariant pT distribution of Lambda for the MB,
soft and hard samples (630 GeV)
The inclusive inavriant pT distributions of Lambda (MB< soft and
hard) at 630 GeV.
The two functions give respectively: <pT>=0.90+-0.07 and <pT>=0.97+-0.01
GeV/c
10. dependence of the mean pT on the event charged
multiplicity (MB, 1800 GeV)
(the mean pT in figs 10 to 15 is not computed from the fit of the
distribution but
as the mean value of the measured pT of all the k/Lambda observed)
11. dependence of the mean pT on the event charged
multiplicity (Soft, 1800 GeV)
12. dependence of the mean pT on the event charged
multiplicity (Hard, 1800 GeV)
13. dependence of the mean pT on the event charged
multiplicity (MB, 630 GeV)
14. dependence of the mean pT on the event charged
multiplicity (Soft, 630 GeV)
15. dependence of the mean pT on the event charged
multiplicity (Hard, 630 GeV)
16. dependence of the mean number of k on the event
charged multiplicity (1800 GeV)
Average number of k per event and per charged track, plotted as a
function of the
number of charged tracks (event multiplicity).
17. dependence of the mean number of Lambda on the
event charged multiplicity (1800 GeV)
18. dependence of the mean number of k on the event
charged multiplicity (630 GeV)
19. dependence of the mean number of Lambda on the
event charged multiplicity (630 GeV)
Other plots:
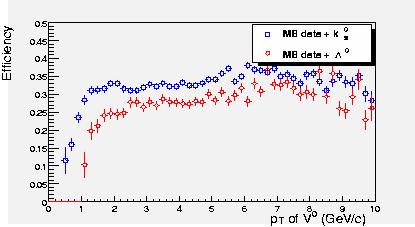
1. efficiency(pT): the efficiency
for finding K and L0 as a function of their pT
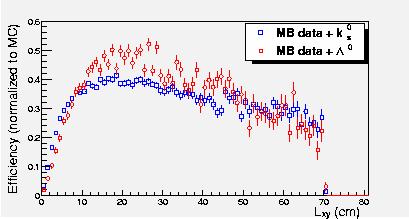
2. efficiency(Lxy): the efficiency
for finding K and L0 as a function the secondary vertex
displacement in the transverse plain
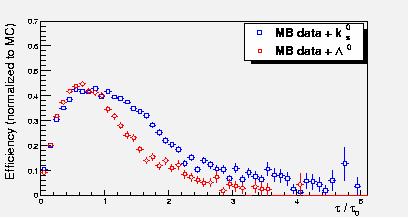
3. efficiency(t): the efficiency for finding K and
L0 as a function of lifetime/<lifetime>
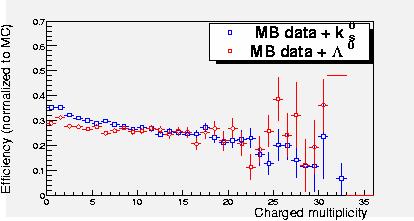
4. efficiency(Nch): the efficiency for finding K
and L0 as a function of the charged
multiplicity of the event
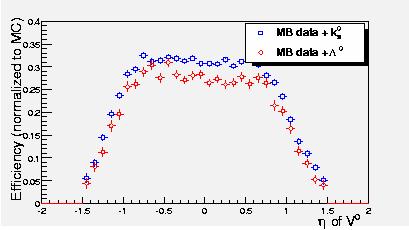
5. efficiency(eta): the efficiency for finding K
and L0 as a function of their pseudo-rapidity