Test of Photomultiplier Tubes for the CDF EndPlug Calorimeter
About 2,100 Mod. R4125 PMTs were purchased from Hamamatsu for the CDF II End Plug Calorimeter (1806 needed + spares), about 1300 where tested at Fermilab and 800 in Bologna using two similar test setups and very similar test procedures.
The Fermilab test setup (Lab 2) has been disassembled, the test setup in Bologna is still functioning and is now measuring the PMTs that have been replaced by Hamamatsu (about 90 PMTs) because failed our specifications (plus about 60 old PMTs that need to be remeasured).
The description that is given here refers particularly to the measurements performed in Bologna.
The parameters measured for each PMT are stored in a Data Base (Filemaker-Pro DB on a Macintosh).
A WEB version of the PMTs Data Base is available: Query the PMTs Data Base HERE!.
The parameters stored in the PMTs Data Base are:
PMT Serial Number, PMT Status, Cathode Luminous Sensitivity, Cathode Blue Sensitivity, Voltage for Gain=500K, Dark Current for Gain=500K, Delivery Date, Initial Test Date, Full test Date, Full Test Location, Base Serial Number, K and P parameters (Initial test), Quality of fit for G(V) (Initial test), Dark Current (Initial test), Gain of Dark Current meas (Initial test), DC current for the Initial Pulsed/DC Test, Shift (%) from the Initial Pulsed/DC Test, Drift (%/Day) from the Initial Pulsed/DC Test, PMT Class, K and P parameters (Full test), Quality of fit for G(V) (Full test), Dark Current (Full test), Gain of Dark Current meas (Full test), ENF at 500K Gain, (ENF at 50K)/(ENF at 500K), % PHR Dev, DC curr for the Stability Test, Maximum % deviation for the Stab Test, Average Drift (%/Day) for the Stab test, Turn-on Time, Temperature of tests, Time to return, DC current for Pulsed/DC test, Shift % for pulsed/DC test, Drift (%/Day) for pulsed/DC test, Maximum Peak Current for G=10K (50K, 100K, 500K), QE at 480nm.
PMTs Location
Presently the PMTs are stored on shelfs in a reserved room at Lab5 (Fermilab) (contact person: Masa Mishina). Except for few PMTs (90 new from Ham. + 67 of the old ones) that are presently under test in Bologna (contact person: Stefano Zucchelli). The tests are expected to be finished by end of March '98.PMT Assembly
PMT assembly consists of an electrostatic shield, a magnetic shield, a lucite light mixer, a base package, a cookie, and several parts which keep the assemply light-tight, properly ground the ougter envelope and allow the light mixer to be positioned precisely with respect to the cookie surface leaving a 2mm air gap once the PMT is mounted in the End Plug.
The setup is able to test 30 pmts simultaneously.
The PMTs are housed in a light-tight temperature-controlled box.
Each pmt can be lighted by three indipendent light sources: a red led array,
a green led array, a laser light. Each pmt is optically coupled to each
light source by clear fibers.
The tests are carried on in a quasi-automated way by a NIM/CAMAC
PC-controlled DAQ System.
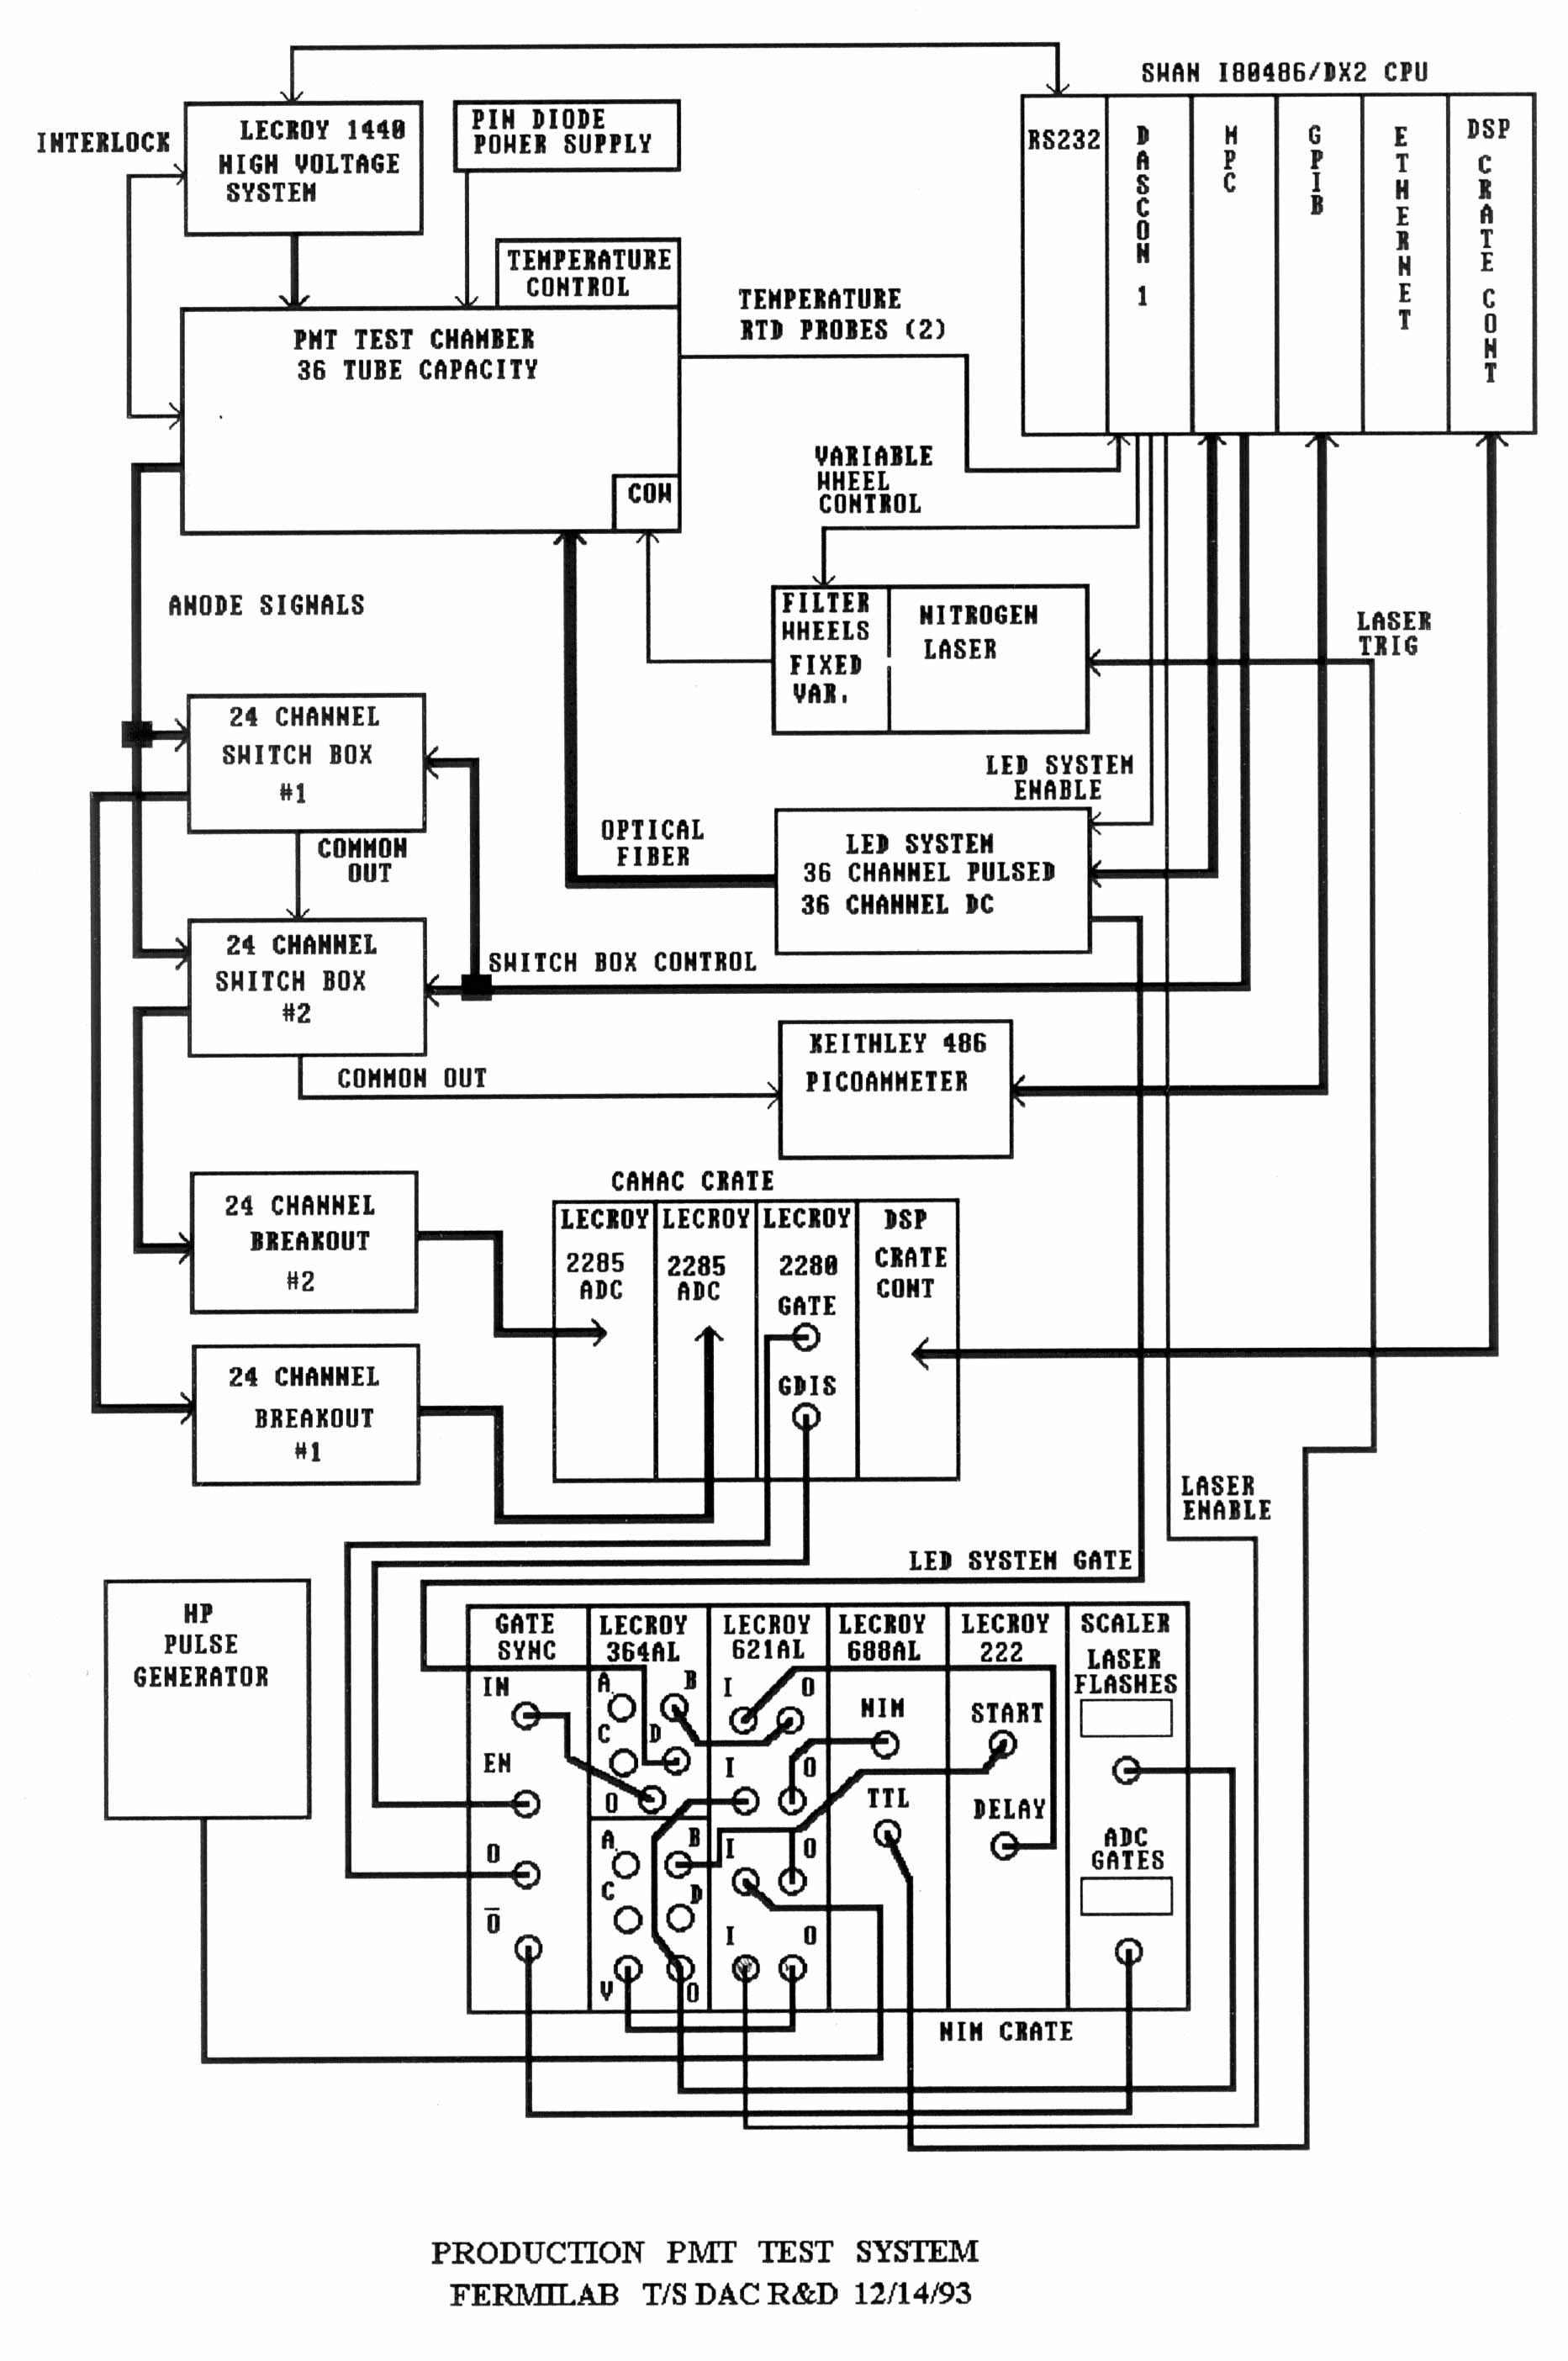
Fermilab Test Setup Block Diagram.
Bologna Test Setup Block Diagram.
Test Procedure
Hamamatsu performs a Burn-in procedure on each PMT that consists in exposing the PMT to a 250microA steady current for ... hours.
The Gain is measured recording the distrubution (Pulse Height Spectrum) of the PMT responses to 10,000 light flashes of a red (560nm) LED (so called Statistical Method ).
The formula is: Gain = (A/e)*(sigma^2/mean)*(1/ENF)
Where:
Using the formula above the Gain is measured at a Voltage of 1600V (at which G is above10^6 and we can assume ENF is close enough to unity). Then the gain at other voltages is measured simply taking the ratio of the mean value of the distribution of the signal to the mean value of the distribution at 1600V.
The Gain is measured in 100V steps, from 700V to 1800V.
The measuring cycle is the following:
Two sets of data takeing are made in order to fit into the ADC dynamic range: first the low voltages points (700, 800, 900, 1000, 1100, 1200) are measured, then the led light is lowered from about 4000 to about 300 photo-electrons per pulse (DAC level) and the high voltages points (1000, 1100, 1200, 1300, 1400, 1500, 1600, 1700, 1800) are measured. Finally the two sets of data points are soldered using the three points in common.
Data points are fitted with a power-law: log(G) = P*log(V)+ K
Two such G-V runs are made:
The K and P parameters, for both the A and B runs are recorded in the PMTs DataBase.
The Dark Current is measured during the G-V test. The PMT anode current is measured at each voltage 10 minutes after the PMT voltage has been set.
A power-law fit is made on the data points: ln(I) = P2*V + P1 (P1,P2 are the fit parameters).
The PMT is accepted if the DC value at G=500K is less than 5nA.
The value that is recorded in the pmt DataBase is the Dark Current value at the Anchor Point.
Anchor Point is the first (V,Gain) data point at which the measured pmt Gain is above 10^6.
Stability with Background DC light Test (so called "Pulsed/DC Test")
In this test we measure how much the pmt response to pulsed light changes when the background DC light (produced by a steady-state green LED) is changed.
In this tests the pmts are excited by light flashes from a laser.
The UV laser light is carried throught a quartz fiber to a Light distributor (Cow) that shifts the light into green (480nm) and distributes it to the 30 pmts under test. The laser light is monitored flash by flash by a PIN diode, in this way the flash by flash light intensity fluctuations (that are pretty big) are removed by taking the ratio of the pmt and the PIN diode responses. (for each pmt the plotted number vs time is the ratio of pmt signal over diode signal normalized to the value measured at time=0).
This test lasts about 20hr, every 15 minutes the laser produces 100 flashes (at 1Hz. repetition rate) and the mean value of the pmt responses is recorded. The first 11 sets of 100 flashes are made with the green LEDs off. Then 11 sets are made with the green LEDs on producing a DC anode current of about 200nA at the pmts. This sequence of 11 on + 11 off is repeated 3 times. Then the same overall sequence is repeated with the green LEDs on at 1microA.
The parameters calculated from the data, and recorded in the pmt DataBase are:
In this test we measure how long it takes to the pmt to return, within a given percent, to the nominal response when the HV is returned to the initial value after it has been lowered to and kept at 100 Volts for 1/2hr.
The pmt is set at 100V and flashed with 100 pulses from the laser for 10 times 1.5 minutes apart. The mean value of these measurements (normalized to the PIN diode signals) set the nominal pmt response at 100V. Then the HV is raised to 1100V and the same procedure is repeated. The overall procedure is repeted twice.
The parameter extracted from the data is the
Time to Return.
In this test we check the stability of the pmt response with time, when the pmt is working in an environment similar to the one it will be exposed to in the Calorimeter.
The Calorimeter underlying event is mimic by the DC light from a steady state green LED that produces a pmt anode current of about 200nA (later raised to 500nA).
The pmt is flashed every 15 minutes by 100 laser flashes (at about 1Hz), the mean value of the Pin diode corrected responses is recorded and normalized to the value taken at time t=0.
The Test lasts for about 80hr.
For each pmt the above values are plotted vs time. For each pmt the ADC channel pedestal value is also monitored.
From these plot for each pmt are calculated:
Linearity Test
In this test we measure up to which anode current (I_peak) the pmt response is linear with the input light signal intensity. The measure is made at four different Gain values (10^4, 5x10^4, 10^5, 5x10^5).
The pmt is flashed with laser light pulses, the intensity (number of photons) of which is indreased subsequently (and then decreased) moving one end of the quartz fiber in front of the laser light spot.
A linear fit is made on the data points (x,y)=(PIN Diode signal, pmt signal) (the PIN diode signal being linear in this range of light intensity it is used basically to measure the intensity of the laser light). The fit is made in two steps: first a linear fit is made on all of the data points, and the point of maximum deviation is found (and called *), subsequently a new linear fit is made on the data points up to the *.
We call I_peak the anode current for which the data (x,y) points deviates from the fitted line by more than 2%.
The current (I) is calculated from the y = pmt signal = electric charge = Q using a triangular shape for the pmt signal with 14ns wide base: I = 2*Q/(14ns).
Actually the pmt voltage signal (on the scope) is not exacly triangular, there is a little exponential tail above 14ns, so that our extimate of I (and I_peak) can be slightly understimated.
Two situations can happen: the (x,y) curve bents downward and deviates more than 2% from the fit line, or the curve bents downward less than 2% (or we do not observe any bent at all). In the first case we record I_peak (in mA) in the pmt DataBase with a + sign (and we say that the pmt has reached the linearity limit at I_peak), in the other case we record in the DB as I_peak the maximum anode current reached out of the pmt during the test and put a minus sign in front of it in order to distinguish.
We have observed for some of the pmts an Over-linear behaviour, that is the (x,y) curve bending upward: for these pmts the 2% deviation from the fit line is positive, I_peak is recorded using the same convention.
The figure of merit for this test is a lower limit on I_peak:
Maximum Peak Current.
Relative Quantum Efficiency Test
This measurement is made for monitoring purposes on a subsample of about 10% of the phototubes. For each bach of 30 tubes testes, the 3 pmts that have the lowest rated value for the blue cathode sensitivity from the vendor have their Relative Quantum Efficiency measured.
The measurement is made counting the number of photoelectrons produced at the photocathode by electrons from a radioactive source (Ru_106) exciting a standard tile/fiber combination to which the pmt is optically coupled in a very reproducible way (measurements on the same tube are reproducible at a 10% level).
The rated value (from Hamamatsu) for the pmts Absolute Quantum Efficiency at a wavelenght of 480nm is 12%.
The essential informations for each pmt are stored in a Filemaker-Pro Database file on a Macintosh (in Bologna), a Web version on the PMT DataBase is available.
Info Parameters
PMT Serial Number: It is of the type: CX # # # #. (there are few ZA # # # # too). The 4 digits number goes from 0063 to 3686 (but not all the numbers exist!). Serial numbers are in order of increasing manufacturing date. All of the PMTs were manufactured by Hamamatsu (Japan) between Feb. '94 and April '95.
Base Serial Number: It is the 5 digits number written on the PMT base. The base is associated to each PMT at Assembly time before starting with any test, and must be kept with it.
Delivery Date: It is the date (mm-dd-yy) the PMT was checked in at the Fermilab Ship & Receiving Office. Tubes were sent from Hama. (Japan) to Fermilab in batches of 100.
Initial Test Date: date of Initial test: mm-dd-yy for the PMT. Initial Test was performed at Fermilab (Lab2) for all of the PMTs.
Full Test Date: date of Full test: mm-dd-yy for the PMT. Full Test was performed at Fermilab (Lab2) or in Bologna (INFN Laboratories), see Full Test Location. This date could be helpfull in finding the files containig raw data, plots, or analysis results for the PMT.
Full Test Location: Can be: Lab2 = at Fermilab, or Bologna.
Cathode Luminous Sensitivity:
Is the photoelecton current measured at the photocathode per unit of incident light flux (in lumen), the light being emitted by a tugsten filament lamp operating at a filament temperature of 2856K. The unit is A/lumen.
Cathode Blue Sensitivity:
Is the same as Cathode Luminous Sensitivity, but the lamp light is first filtered through a blue filter before hitting the photocathode.
Voltage for Gain = 500K:
It is the pmt voltage for a Gain of 500K measured by Hamamatsu. In comparing this with our measurement keep in mind that Hamamatsu uses a different method (direct method), that is this is the ratio of the anode to the catode currents. As a consequence this measurement is not affected by the Error Noise Factor.
Dark Current for Gain = 500K:
Dark Current measured by Hamamatsu setting the pmt' voltage at Voltage for G=500K previously measured.
Relative Quantum Efficiency at 480nm:
Is the number of photoelectrons (N_pe) out of the sci_tile+WLS_fiber source (excited by a Ru-106 rad. source). This number is calculated counting the frequency of pedestal counts in the pulse high spectrum. That is, assuming a Poissonian distribution for the number of photoelectrons (n), the average number of photoelectrons can be determined as follows :
P(n) = (exp(N_pe)*N_pe^n)/n! --> N_pe = ln(P(0))
Temperature of tests:
Temperature in the test chamber is monitored by 3 thermo-couple temperature sensors: 1 is located in the hot side of the chamber were the pmt bases are, 1 is located in the warm side close to the LED circuits, 1 is located outside the chamber to monitor the room temperature. The chamber is conditioned by a Peltier-effect device in the hot side and a water pipes system on the warm side. The temperature in the chamber is kept at 23-25 C.
The number given here is the average temperature (6 rms) recorded during the time-stability test (72 hours).
K and P parameters for the G(V) curve:
These are the parameters of the linear function fit to the (log(voltage), log(gain)) data points:
log(G) = P*log(V)+ K
We have two couples of (K,P) parameters: one from the Initial Test and one from the Full Test. The one to be used to calculate Gain(V) is (K,P) from the Full Test.
Quality of fit: Chi square per d.o.f. for the fit of (logV,logG) data points to a line.
Dark Current at G = Anchor_Point:
Anchor Point is the first (V,Gain) data point at which the measured PMT Gain is above 10^6. The value of Dark Current at G=A.P. is calculated from the power function fit to the data points (V,I) (see Dark Current Test). It is the maximum expected value of Dark Current when the PMT will be operating in the Plug (in the Plug the PMTs will be operated at Gain=25K and Gain =250K for the EM and HAD sections respectively). …also keep in mind that the PMT Dark Current tends to decrease with time even though the tube just rested on shelf all the time.
In order for the PMT to be Accepted must be: Dark Current < 5nA at Gain = 500K.
Gain of Dark Current meas.: by definition (see above) it is always > 10^6.
Pulse Height Resolution
Given a PMT Pulse Height Spectrum obtained exciting the PMT with light flashes of equal intensity,
PHR = sigma / mean
If we ignore the statistical error of the electrons multiplication process at the dynodes, and assumed that number of photoelectrons produced at the photocathode by equal light flashes to be Poissonian distributed with average value N_pe, it follows:
sigma = SQRT(N_pe) --> PHR = 1 / SQRT(N_pe)
But, because of the statistical process of electrons multiplication, the number of photoelectrons is not exactly Poissonian distributed, thus:
PHR = SQRT(ENF) / SQRT(N_pe),
ENF = Error Noise Factor = 1 + 1/(x-1),
x = dynode multiplication factor, assumed to be the same at each dynode.
x depends on the inter-dynode voltage, increasing with it. Thus ENF depends on the PMT voltage too, i.e. it decreases when the PMT Gain increases, being 1 nominally for G = infinity. At any finite Gain, ENF > 1. As a matter of fact for R4125 we can assume ENF = 1 at Gain = 10^6.
ENF at 50K / ENF at 500K:
how much ENF changes going from G=50K to G=500K (should be always >1).
It is calculated from the PMT Pulse Height Spectra measured at PMT voltages giving gains close to 50K and 500K:
ENF at 50K / ENF at 500K = (sigma^2/mean)G=50K / (sigma^2/mean)G=500K
PHR Deviation (%):
is the percentage deviation of PHR from the ideal value 1 / SQRT(N_pe) at the PMT Gain = 50K. It is calculated from the above parameters:
%PHR dev = (ENF_50K / ENF_500K)*SQRT(ENF_500K) - 1
DC Current for Pulsed/DC Test:
it is the PMT anode current in nA produced by the DC green LED light when the Pulsed/DC test parameters (SHIFT and DRIFT below) are measured. (it is around 500nA).
Pulsed/DC Test SHIFT (%):
it is the percentage change in the PMT response to pulsed light when the DC green LED background light is turned ON (at about 500nA). It can be positive (meaning that the PMT response has increased) or negative (meaning that the PMT response decreased).
In order for the PMT to be Accepted must be: abs (%SHIFT) < 5%
Class: can be A, B, or C according to the value of % DRIFT measured in the initial Pulsed/DC test. Class A is a good PMT, a class C PMT had a very large (positive) %DRIFT in Initial Pulsed/DC test , a class B PMT are ones for which the test must be repeated due to other instrumental problems. After the Initial Pulsed/DC test the PMTs are conditioned. Most of Class C, B PMT showed an acceptable % DRIFT value in the later Pulsed/DC Full test, this recovering seems due to the Conditioning procedure.
DC current for Time Stability Test: it is the PMT anode current in nA (around 200nA) from a DC green LED on during the time stability test.
Maximum Deviation in 48hr: it is the maximum percentage change in the PMT response to pulsed light in any 48 hours period within the 72 hours duration of the time stability test. A positive value actually means a decrease in the PMT response.
In order for the PMT to be Accepted must be: Maximum Deviation in 48 hours < 6%
Average DRIFT (%/Day) for the Stab. Test: same definition as %DRIFT in Pulsed/DC Test given above.
Turn-On Time: time (in hours) it takes to the PMT to aproach a stable response. It is measured performing a linear fit to the Time Stability test data points from t = 0 to t = 20hr. Turn on Time is the time at which the deviation of data points from the fitted line becomes less than 3%.
In order for the PMT to be Accepted must be: Turn-On Time < 10 hours
Time to return: Measured in the HV on/off test. It is the time (in minutes) it takes to the PMT to return within 2% to its nominal response when the voltage is raised from 100V back to 1100V.
In order for the PMT to be Accepted must be: Time to Return < 10 minutes
Maximum Peak Current at G=10K (50K, 100K, 500K):
it is the PMT anode current at the peak of the triangular shaped pulse for which the PMT response deviates from the linear behaviour by more than 2%.
Since the range of Peak Anode Current we could test was necessarely upper limited (by the maximum reachable intensity for the laser light, around …. photoelectrons) we adopted the following convention:
a Positive value of Maximum Peak Current means that the PMT actually reached a > 2% non-linearity at that Peak Current value,
a Negative value of Maximum Peak Current means that the PMT was tested UP to that absolute value of Peak Current but it didn't show any non-linearity up to that I_peak.
In order for the PMT to be Accepted it must be: